F1 Pit Stop Markets: Timing Bets, Undercut Strategy and the Numbers Behind the Stops
 Available in US
Two Seconds That Can Pay for Your Entire Weekend
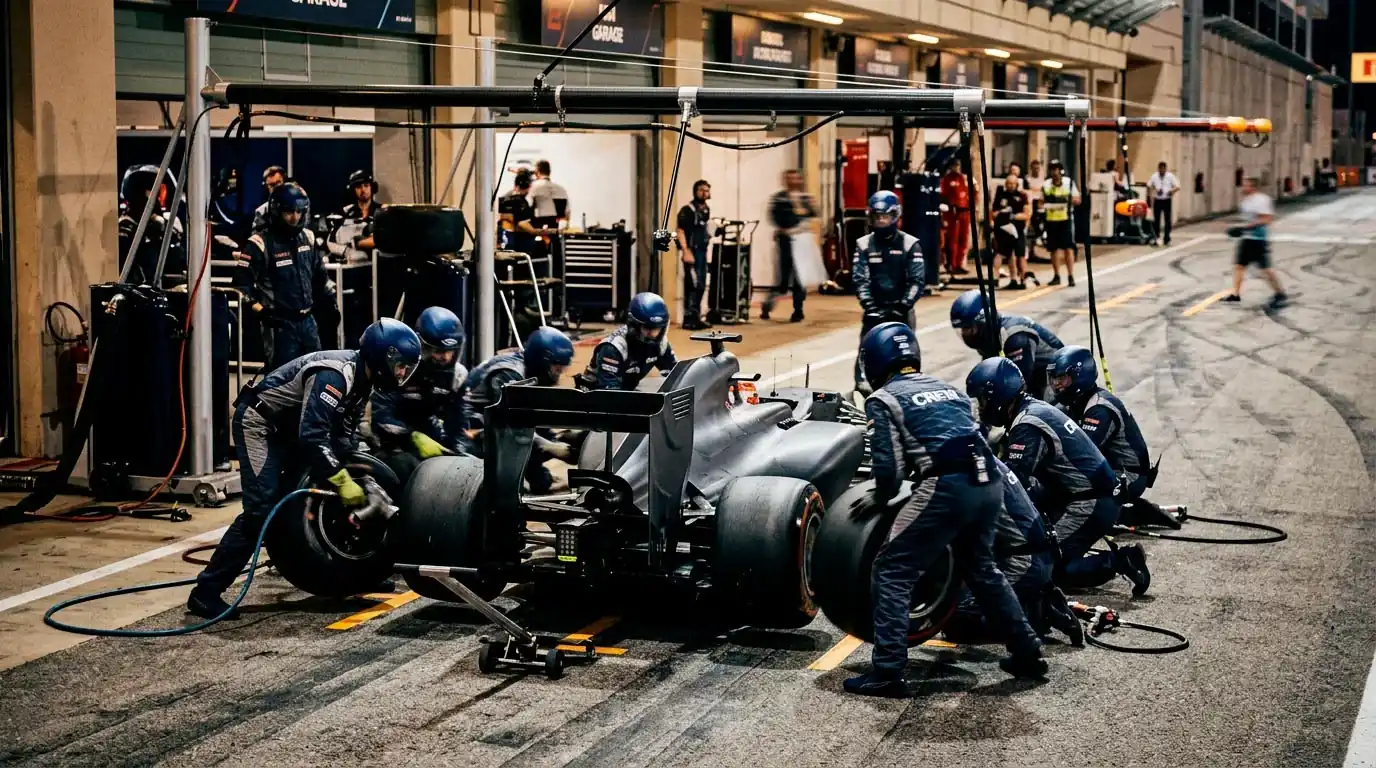
The average F1 pit stop takes less than 2.5 seconds from wheels-off to wheels-on. That is faster than a sneeze. Yet those 2.5 seconds, multiplied across two or three stops in a race, decide championships and settle thousands of bets. I have spent enough time watching the pit lane entry camera to know that the drama of a botched stop — a stuck wheel nut, a cross-threaded gun, a driver overrunning the box by half a metre — is the most compressed form of sporting chaos you can bet on.
Pit stop markets are niche within the F1 betting ecosystem, but they are growing. F1 accounts for just 0.4 per cent of the global betting handle, yet the prop markets around pit stops attract disproportionate attention from experienced bettors who recognise that the data is more predictive here than in almost any other F1 market. The pit stop is a controlled, repeatable event with measurable variation — the perfect conditions for statistical edge.
See also: check betting f1 for all F1 in-race markets.
What UK Bookmakers Offer in Pit Stop Markets
Not every sportsbook lists pit stop markets, and those that do tend to offer them only on race day rather than pre-weekend. The standard markets include: fastest pit stop of the race (which team records the quickest stop), total number of pit stops in the race (over/under a line set by the bookmaker), and first driver to pit. Some larger sportsbooks also offer pit stop matchups between two named teams, settled on which team’s fastest stop is quicker.
The fastest pit stop market is the most data-rich. Pit stop times are published officially by the FIA for every race, and the historical data reveals clear patterns. Certain teams invest heavily in pit crew training and equipment — the difference between a 2.1-second stop and a 2.8-second stop comes down to crew coordination, equipment quality, and practice frequency. Teams that consistently record the fastest stops season after season do so because of systematic investment, not luck, and that consistency makes the fastest-stop market surprisingly predictable.
The total pit stops market correlates directly with tyre strategy and circuit characteristics. At a high-degradation circuit where a two-stop race is expected, the total stops across all 20 drivers will typically land between 38 and 44. At a low-degradation one-stop circuit, the total drops to 22-28. The bookmaker sets a line in between, and the value lies in identifying which way the practice data pushes the likely strategy split before the market adjusts fully.
The Undercut and Overcut: Pit Timing as a Betting Signal
Every punter who watches F1 has heard a race engineer say “box, box” on the team radio. What most do not appreciate is the strategic calculation behind the timing of that call. The undercut — pitting one lap before a rival to gain time on fresh tyres while the rival is on worn rubber — is the primary offensive weapon in F1 pit strategy. When an undercut works, the pitting driver emerges ahead of the driver who stayed out. When it fails, the pitting driver loses time in the pit lane and drops further behind.
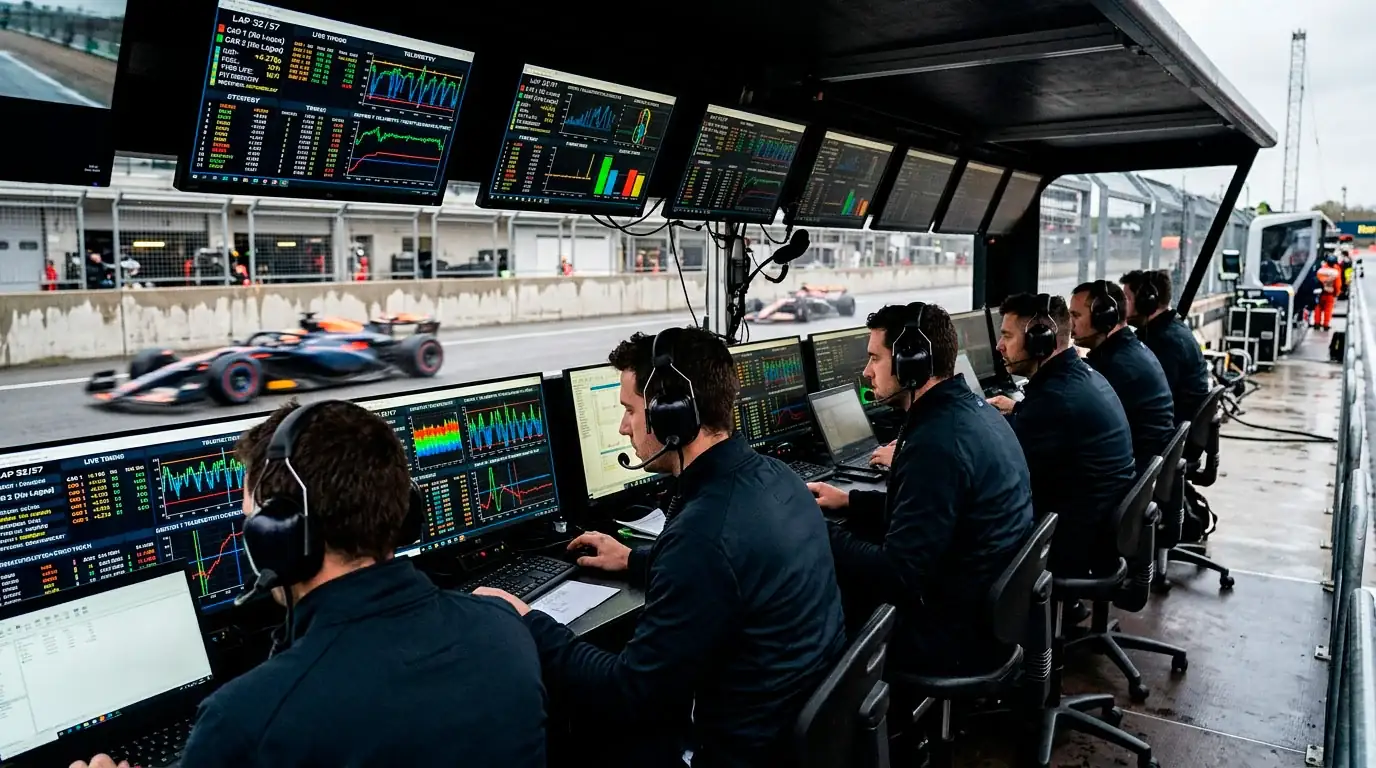
For in-play betting, the undercut attempt is a price catalyst. When a driver pits unexpectedly early — a lap or two before the optimal window — the bookmakers know a strategic move is in play, and the odds on the affected drivers shift immediately. The driver attempting the undercut sees their win or podium odds shorten momentarily, while the driver being undercut sees their odds drift. If you are watching the race with timing data open and you spot a premature pit stop, you have roughly 60 to 90 seconds to react before the live odds fully adjust.
The overcut — staying out longer on used tyres while a rival pits and then exploiting a clear track to set faster lap times before pitting yourself — is the counter-strategy. It works best at circuits where new tyres take several laps to reach operating temperature, because the clear-air advantage of an empty track outweighs the tyre performance deficit. At races where the overcut is viable, the first driver to pit actually loses the strategic initiative, which inverts the usual live-odds reaction.
Pit Crew Performance Data: A Market the Bookmakers Undervalue
F1’s digital audience engagement during race weekends exceeds 30 per cent across betting-related content, and pit stop data is among the most shared post-race statistics. Yet the pre-race odds on pit-stop markets rarely reflect the full depth of available crew performance data.
See also: understand tyre choices that drive pit calls in our F1 tyre strategy betting guide.
Over a season, the gap between the fastest and slowest pit crew averages roughly 0.8 to 1.2 seconds per stop. That sounds small, but compounded across two stops it translates to 1.6 to 2.4 seconds — enough to swap grid positions in a tight race. The teams at the top of the pit-stop rankings tend to stay there because crew performance is a function of investment, personnel stability, and practice repetitions rather than race-day variance.
Where the value emerges is in the variance of the slower crews. A team that averages 2.6 seconds per stop but has a standard deviation of 0.5 seconds is a team that occasionally posts a 2.1-second stop and occasionally a 3.1-second disaster. If the fastest-stop market prices that team based on their average, the probability of them recording the fastest stop on any given day is underestimated — their occasional outlier performance is not captured by the mean. Conversely, a team with a low average and low variance (say, 2.2 seconds with a 0.15-second standard deviation) is more consistent but less likely to produce the single-fastest stop of the race, because their range is narrower.
Double-stack pit stops — where both of a team’s drivers pit on the same lap — are a particular stress test. The second car waits behind the first, losing several extra seconds while the crew services the lead car and then repositions for the second. Teams that practise double stacks and execute them cleanly gain a strategic option that teams with less reliable crews cannot afford. Tracking which teams have successfully double-stacked in recent races tells you which teams have a strategic flexibility advantage that the standard market pricing does not explicitly capture.
What determines the fastest pit stop in an F1 race?
Pit stop speed depends on crew training, equipment quality, and the number of practice repetitions the team invests in. The fastest stops consistently come from the same three or four teams each season because crew performance is systematic, not random. The gap between the fastest and slowest crews averages 0.8 to 1.2 seconds per stop. Teams with low average stop times and low variance are the safest bets for the fastest-stop market.
How does the undercut affect F1 live betting odds?
When a driver pits unexpectedly early to attempt an undercut, live betting odds on the affected drivers shift within 60 to 90 seconds. The pitting driver’s odds shorten as the market prices in the potential position gain, while the rival being undercut sees their odds drift. If you are watching with timing data and spot the premature pit entry, you have a brief window to act before the live odds fully adjust.
Published by the Betting f1 team.