F1 Odds Explained: How to Read, Compare and Use Them in 2026
 Available in US

- Odds Are the Language of F1 Betting — Here Is How to Speak It
- Fractional Odds: The UK Standard
- Decimal Odds: The European and Exchange Format
- Implied Probability and Overround: Where Bookmaker Margin Hides
- Comparing Odds Across Bookmakers: Practical Workflow
- Why F1 Odds Shift: Practice, Qualifying and Race-Day Catalysts
- Championship Odds Dynamics Over a 24-Race Calendar
- Questions About F1 Odds
Odds Are the Language of F1 Betting — Here Is How to Speak It
A few years into covering F1 betting, I got a message from a reader who had placed what he thought was a brilliant bet on a midfield driver at “10/1 odds.” He had actually placed it at 1.10 decimal odds — a near-certainty price that paid almost nothing. He had confused the formats and staked serious money on a return of 10p per pound. That story is more common than you would think, and it is why I always tell people: odds are not numbers to glance at. They are the language the entire market speaks, and if you cannot read them fluently, you are betting blind.
The global sports betting market was valued at $32.86 billion in 2025 and is growing at a compound annual rate of 10.8%. The online segment alone is projected to hit $92.49 billion by 2031. All of that money — every pound, dollar and euro — flows through odds. They are the mechanism that translates probability into price, and the only tool you have for judging whether a bet is worth taking.
This guide breaks down the two odds formats UK punters will encounter most often, explains how to convert between them, unpacks the concept of implied probability and bookmaker overround, and walks through the specific catalysts that shift F1 odds from practice to race day. I have kept the maths simple and included worked examples you can replicate with a calculator.
See also: check betting f1 for all F1 odds and markets.
Fractional Odds: The UK Standard
I grew up seeing odds on the High Street — chalked on boards outside betting shops in that distinctly British fractional format. There is something intuitive about 5/1 that a decimal number does not quite capture: you are being told, in plain terms, that for every one pound you risk, you win five pounds profit. The simplicity is the appeal.
Fractional odds express the profit relative to the stake. At 5/1, a ten-pound bet returns sixty pounds total — fifty pounds profit plus your ten-pound stake back. At 2/1, that same ten-pound bet returns thirty pounds. The first number is always the profit; the second is the stake required to earn that profit. When the first number is larger than the second, the outcome is considered unlikely — a longshot. When the first number is smaller, the outcome is more likely — a short-price favourite.
Where fractional odds get less intuitive is in the in-between prices. 11/8 does not roll off the tongue the way 5/1 does. Neither does 4/6, which is an odds-on price where you need to stake six pounds to win four pounds profit. F1 race winners at top circuits often go off at fractional prices like 4/7 or 8/13, and mentally calculating returns on those fractions mid-race is not straightforward for most people.
There is also the question of comparison. If one bookmaker offers 7/2 on a driver and another offers 15/4, which is better? Both are close, but 15/4 (3.75 profit per pound) is marginally more generous than 7/2 (3.50 profit per pound). The mental arithmetic required to compare non-standard fractions quickly is a genuine barrier, and it is one reason many experienced bettors — myself included — switched to decimal odds for analytical work even while still reading fractional odds in UK retail environments.
For beginners placing F1 bets at UK bookmakers, fractional odds are the default display. Most platforms let you toggle to decimal in the settings, but the promotional materials, shop windows and television graphics overwhelmingly use fractions. Understanding them is not optional if you bet in the UK — it is the entry-level literacy requirement.
Decimal Odds: The European and Exchange Format
The first time I used a betting exchange, I had to rewire how I read odds. Exchanges default to decimal, and once you get used to the format, there is no going back for analytical work. Decimal odds represent the total return per unit staked, including the stake itself. An odds price of 6.00 means a one-pound bet returns six pounds total — five pounds profit plus the original pound. That 5/1 fractional price and 6.00 decimal are exactly the same thing.
The conversion is clean: decimal odds = (fractional numerator / fractional denominator) + 1. So 7/2 becomes (7/2) + 1 = 4.50. And 4/6 becomes (4/6) + 1 = 1.67. In reverse, to go from decimal to fractional, subtract 1 and express the result as a fraction: 3.25 becomes 2.25/1, which simplifies to 9/4.
Decimal odds make comparison trivially easy. Is 4.50 better than 4.33? Obviously. Is 7/2 better than 13/3? That takes a moment to work out. When you are scanning five bookmakers for the best price on a driver before qualifying, the speed advantage of decimal format is substantial. I keep my odds comparison spreadsheet entirely in decimal for this reason, converting to fractional only when I write about specific UK retail contexts.
European and international bookmakers use decimal as standard. Betting exchanges — which are particularly relevant for F1 given the ability to lay a driver as well as back them — operate exclusively in decimal. If you plan to trade F1 positions in-play (backing pre-race and laying during the race to lock in profit), decimal odds are essential because the profit calculation requires simple multiplication rather than fraction gymnastics.
One subtle advantage of decimal odds: they make the bookmaker’s margin visible at a glance. If you sum the reciprocals of all the decimal odds in a race winner market (1/odds for each driver), the total should equal 1.00 in a perfectly fair market. In practice, it will be higher — that excess is the overround, which is the bookmaker’s built-in profit margin. In fractional format, calculating that overround requires converting every price first. In decimal, it takes thirty seconds.
Implied Probability and Overround: Where Bookmaker Margin Hides
Every set of odds contains a hidden number that tells you what the bookmaker really thinks. That number is the implied probability, and it is the single most useful concept in odds literacy. Once you can extract it, you can compare the bookmaker’s assessment against your own and make rational decisions about whether a bet offers value.
The formula is simple: implied probability = 1 / decimal odds x 100. A driver priced at 4.00 decimal has an implied probability of 25%. A driver at 10.00 has 10%. A heavy favourite at 1.50 has 66.7%. These percentages tell you how often the bookmaker’s model expects that outcome to occur — with a crucial caveat.
That caveat is the overround. If you add up the implied probabilities for all twenty drivers in a race winner market, the total will not be 100%. It will be somewhere between 110% and 130%, depending on the bookmaker and the market. That excess over 100% is the overround — the bookmaker’s margin. It means the implied probabilities are inflated beyond the true probabilities. Every driver’s odds are slightly shorter than a “fair” price, and the bookmaker profits from that difference regardless of who wins.
The UK gambling industry generated total gross gambling yield of 11.5 billion pounds in the year to March 2024, with the online segment contributing 7.8 billion of that. Every penny of bookmaker profit comes from overround and margin structures applied across millions of bets. Understanding overround is not academic — it is understanding the price you pay to participate in the market.
To calculate a “true” implied probability that strips out the overround, you divide each driver’s implied probability by the total overround. If the market overround is 120% and a driver’s raw implied probability is 24%, their adjusted probability is 24/120 = 20%. That adjusted figure is a closer approximation of the bookmaker’s actual model. When your own assessment of a driver’s chance exceeds this adjusted probability, you are looking at a potential value bet.
Different bookmakers run different overrounds on F1 markets. Some set tighter margins on headline markets (race winner) to attract volume and compensate with wider margins on niche props. Others apply a uniform margin across all markets. Comparing the overround across bookmakers before placing a bet is one of the simplest ways to ensure you are getting the best available price — even a 2-3% difference in overround compounds into meaningful returns over a 24-race season.
Comparing Odds Across Bookmakers: Practical Workflow
I have a routine that runs like clockwork every race week. On Wednesday, when markets open, I pull the race winner odds from four or five bookmakers into a spreadsheet. Each driver gets a row; each bookmaker gets a column. The best available odds for each driver get highlighted. This takes about fifteen minutes, and it is the single highest-return activity in my weekly betting workflow.
The differences are not always large, but they are consistent. On a midfield driver priced at 15.00 at one bookmaker and 17.00 at another, the gap represents a 13% difference in potential return on the same outcome. Over twenty-four races and dozens of bets, those margins compound. Shopping for the best odds is not about finding a secret advantage — it is about not leaving money on the table through laziness.
Online GGY in the UK grew 7% year-on-year to 1.45 billion pounds in early 2025, with 13.5 million active betting accounts. That volume of competition among bookmakers means odds divergence is routine, especially in the first few hours after a market opens. Early prices reflect each bookmaker’s initial model; by Saturday morning, prices tend to converge as market forces and balancing activity bring them closer together. The widest discrepancies — and therefore the best shopping opportunities — exist in that Wednesday-to-Friday window.
Odds comparison sites automate part of this process, but I still prefer my own spreadsheet because it lets me track historical pricing patterns. Over time, I have identified which bookmakers consistently price F1 more generously on outright markets, which ones are sharper on race-weekend props, and which ones offer the tightest margins on in-play. That knowledge tells me where to look first for different types of bet, saving time when the market is moving fast.
One practical tip: if you find a significantly better price at a bookmaker you do not normally use, check whether the discrepancy is genuine or the result of a suspended market or stale line. Occasionally, a bookmaker will display odds that have not updated after a significant piece of news — a practice crash, a penalty, a weather change. Those stale lines can represent extraordinary value, but they can also be pulled before settlement if the bookmaker identifies the error. Read the terms on palpable errors before assuming you have found free money.
Why F1 Odds Shift: Practice, Qualifying and Race-Day Catalysts
I once watched Max Verstappen’s race-win odds halve in the space of forty-five minutes during a Friday practice session in Jeddah. He had not even set a competitive lap time yet — his car simply looked planted through the high-speed sweepers on the onboard cameras, and the market reacted before the timing screens confirmed what the eyes already knew. That kind of movement tells you something fundamental about F1 odds: they are a living document, constantly rewritten by new information.
Practice sessions are the first catalyst. FP1 and FP2 give bookmakers and sharp bettors their earliest glimpse of genuine pace on the weekend’s specific circuit. Long-run data — ten or more consecutive laps on a single tyre compound — matters far more than headline lap times, because race pace is what wins on Sunday. If a midfield team suddenly strings together long runs within two tenths of the leaders, their podium odds will shorten before qualifying even begins. The 827 million global F1 fanbase means even subtle telemetry signals spread quickly through social media and specialist forums, putting pressure on the market within minutes of a session ending.
Qualifying reshapes the odds more violently. Grid position correlates with race results at roughly r = 0.85 across modern circuits, so a pole position fundamentally changes every market tied to that race. A driver who qualified third when expected to be sixth will see their win odds compress sharply. Conversely, a front-runner who drops to P10 after a gearbox penalty becomes a long shot — and that is often where the value lies, because mechanical penalties do not erase pace. The car that was fastest in Q3 still has that speed in the race, just from further back.
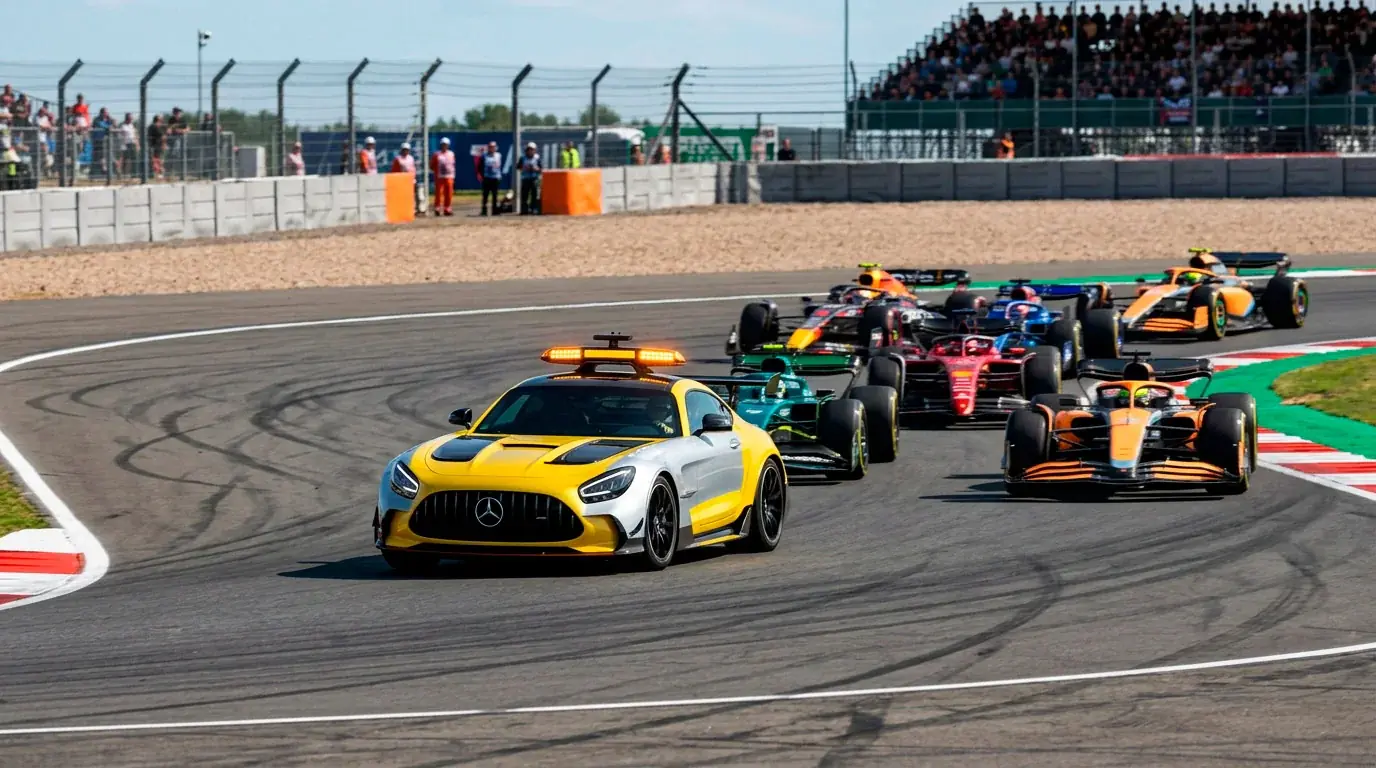
Race-day catalysts are the most dramatic. Formation-lap weather changes, first-lap incidents, safety cars and red flags can make pre-race odds irrelevant in seconds. I have seen a 14/1 shot become race favourite after a Turn 1 collision wiped out two of the three cars ahead. In-play betting thrives on exactly this chaos, but even pre-race odds shift significantly between the market opening and lights out. The walk from the paddock to the grid can involve a rain cloud, a hydraulic leak, or a driver reporting a stomach bug on the radio — each one a catalyst for rapid repricing. The UK’s online betting market alone generates GBP 7.8 billion in gross gaming yield, and motorsport’s share of that is growing precisely because these unpredictable moments create constant trading opportunities.
Championship Odds Dynamics Over a 24-Race Calendar
Here is a thought experiment that reveals how championship odds actually work. Imagine two drivers separated by fifteen points after round eight of a twenty-four-race calendar. At that stage, there are still 416 points available — twenty-six per race weekend including sprint events. A fifteen-point gap is noise, not signal, yet most casual bettors treat the standings leader as a heavy favourite. The championship market is pricing in sixteen more rounds of variance, and that is where patient bettors find edges.
See also: back multiple outcomes with our F1 each way betting guide.
Early-season championship odds move on narrative as much as data. A driver who wins two of the first three races will see their title odds compress dramatically, but the 2026 regulation changes — simplified aerodynamics, active aero, redesigned power units — mean that development rates across the season matter as much as launch-day competitiveness. Teams with stronger in-season upgrade pipelines often close early gaps by mid-summer. Championship futures attract serious institutional money, and that money hunts for exactly these kinds of structural mispricings where early results create false certainty in a twenty-four-race marathon.
The middle third of the season is where championship odds often stagnate — and where I find the best value. Media attention drifts during the European summer stretch, casual betting volume drops, and the market becomes slower to react to upgrade packages and form shifts. If a team introduces a significant floor update at Silverstone that gains three tenths per lap, it can take two or three race weekends for the championship odds to fully adjust. That lag is your window.
Late-season dynamics introduce a different kind of pressure. Once the gap narrows to where a single DNF can swing the title, the odds start pricing in risk aversion — the leading driver’s tendency to protect positions rather than attack, which compresses the points difference and creates false confidence in the chaser. Stefano Domenicali has pushed the calendar to its current density partly because these tense championship run-ins deliver the kind of drama that turns casual viewers into regular bettors — 43 percent of F1’s fanbase is now under 35, the demographic most likely to have an active betting account.
Questions About F1 Odds
What is the easiest way to compare F1 odds across bookmakers?
Open the same market — say, race winner — at three or four bookmakers and convert all prices to implied probability using the formula 1 divided by decimal odds. The bookmaker offering the lowest implied probability for your selection is giving you the best price. Odds comparison sites automate this, but understanding the maths helps you spot errors and stale lines that automated tools sometimes miss.
Why do F1 championship odds change between races?
Championship odds react to race results, penalty decisions, technical upgrades and driver contracts. A single retirement can shift the title market dramatically because F1 awards zero points for a DNF regardless of pace. Development upgrades introduced between races also affect odds, especially during the European stretch when teams bring major aerodynamic packages every two or three weekends.
Are fractional or decimal odds better for F1 betting?
Neither format is inherently better — they express the same information differently. Fractional odds are the UK standard and intuitive for simple prices like 5/1 or 3/1. Decimal odds make comparison and accumulator calculations easier because you simply multiply them together. Most experienced bettors use decimal for analysis and fractional for quick mental arithmetic on familiar prices.
What does overround mean in F1 betting?
Overround is the bookmaker’s built-in margin. If you convert every selection’s odds in a market to implied probability and add them up, the total will exceed 100 percent. That excess is the overround. A race-winner market with twenty drivers might have an overround of 130 percent, meaning the bookmaker is taking roughly 30 percent margin. Lower overround means better value for the bettor.
Published by the Betting f1 team.