F1 Safety Car Betting: How Incident Markets Work and What Drives the Odds
 Available in US
The Market That Bets on Chaos
There is something slightly absurd about placing a bet on whether a race will produce a safety car. You are wagering on the probability of an incident — a crash, a mechanical failure, debris on track — that nobody wants to happen. And yet the safety car market is one of the most popular prop bets in F1, and for good reason. It offers a binary outcome with circuit-level data that makes informed pricing possible. Over 30 per cent of F1’s digital audience interacts with betting content during race weekends, and the safety car yes/no market is often the gateway prop for punters who find the race winner market too complex.
I have been tracking safety car deployment rates across circuits for six seasons, and the data tells a clear story: some tracks produce safety cars with near-certainty, others almost never. That consistency is the bettor’s edge, because the bookmakers price the safety car market across the whole grid rather than adjusting fully for circuit-specific history.
See also: return to betting f1 for more F1 betting insights.
Market Types: Yes/No, Timing, Number of Deployments
The simplest safety car bet is yes/no — will a full safety car be deployed at any point during the race? Most UK sportsbooks offer this with the “yes” side priced at odds-on for the majority of circuits, reflecting the overall season average of roughly 60-65 per cent of races producing at least one safety car over the past five years.
Beyond the binary, some bookmakers offer timing markets: will the first safety car appear before or after a specified lap number, typically set around lap 15. The logic is straightforward — early-race incidents at turn one are the most common trigger, so the “before” side carries shorter odds. The “after” side pays better but requires the race to survive the opening-lap chaos unscathed, which happens less often than you might think.
The most granular market is the number of safety car deployments: over/under a line set by the bookmaker, usually at 1.5 for a standard race. At street circuits with narrow escape roads and high crash probabilities, the line might shift to 2.5. These markets reward circuit-specific knowledge more than any other F1 prop, because the historical deployment frequency varies dramatically from venue to venue.
Which Circuits See the Most Safety Cars — and Why It Matters
F1 pulled 6.7 million spectators through the gates in 2025, a record that partly reflects the sport’s expansion to 24 races across diverse circuit types. That diversity matters for the safety car market because circuit characteristics are the single strongest predictor of safety car probability.
Street circuits top the list consistently. Monaco, Baku, Singapore, and Jeddah all feature narrow tracks, concrete walls with no gravel runoff, and tight corner sequences that punish small mistakes severely. The safety car deployment rate at these circuits over the past five seasons exceeds 80 per cent. Baku is the outlier even among street circuits — its long straight followed by a tight braking zone into turn one produces first-lap incidents with remarkable regularity, and the castle section in the middle sector is a safety car trigger in almost every race.
Traditional circuits with large gravel traps and wide runoff areas — Silverstone, Paul Ricard, Barcelona — sit at the opposite end. Cars can spin off without causing a safety car because the gravel decelerates them before they hit a barrier. These circuits produce safety cars at a rate closer to 35-40 per cent, which means the “no” side of the binary market often carries value at tracks where the bookmaker prices have not fully adjusted for the low-incident profile.
The circuit-specific betting approach extends naturally to the safety car market. Before each race weekend, check the venue’s five-year safety car history, note whether circuit modifications have changed the runoff areas, and compare the bookmaker’s implied probability to the historical rate. If the bookmaker prices “yes” at 1.60 (implied 62.5 per cent) but the circuit’s historical rate is 85 per cent, the market is giving you a gift.
Virtual Safety Car vs Full Safety Car: Different Markets, Different Value
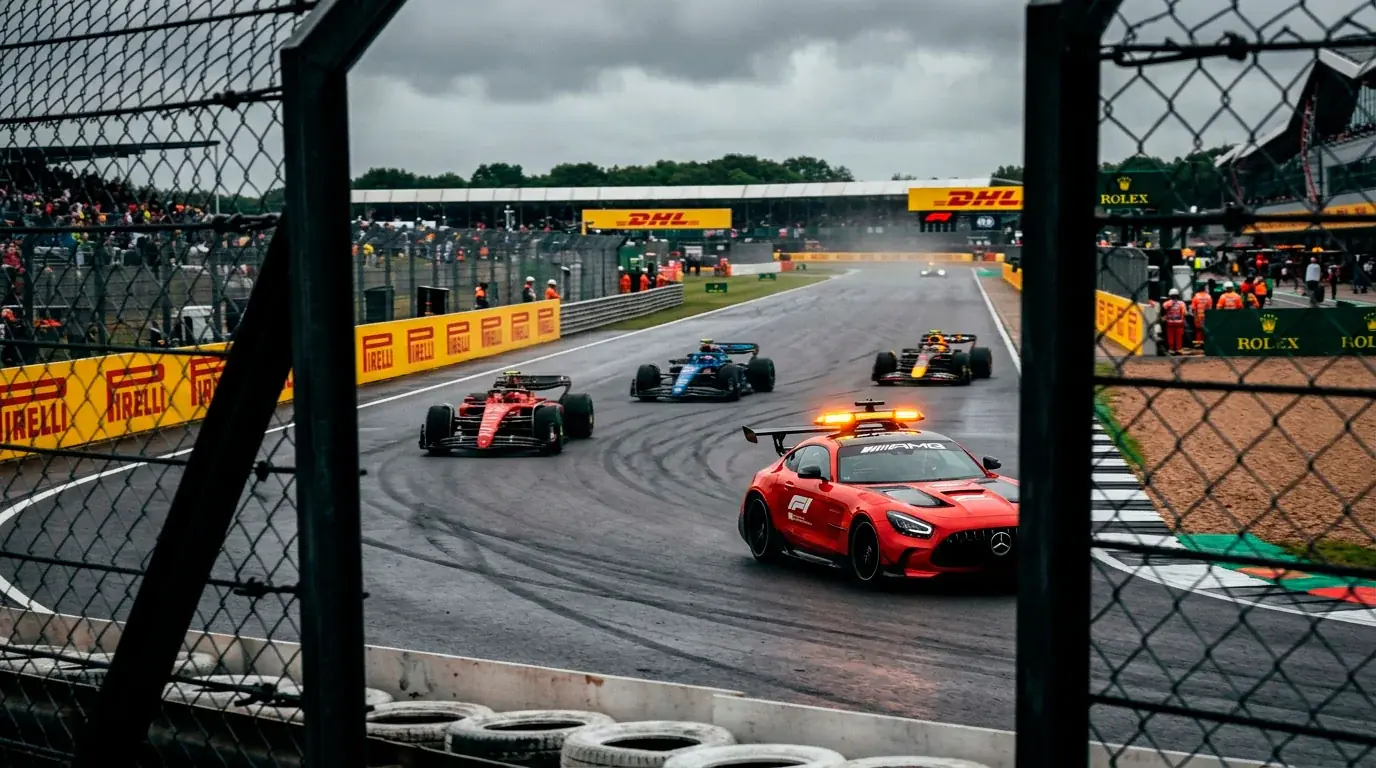
The virtual safety car — introduced in 2015 after Jules Bianchi’s tragic accident at Suzuka — is a separate event from a full safety car, and some bookmakers treat them as separate markets. The VSC requires all drivers to slow to a delta time without forming up behind a physical safety car. It is used for incidents that require intervention but do not need a recovery vehicle on track.
See also: factor in conditions with our F1 weather betting guide.
VSC deployments are more frequent than full safety cars because the threshold for triggering one is lower. A car parked in a safe position at the side of the track might prompt a VSC rather than a full safety car. Over a season, the VSC deployment rate is roughly 15-20 per cent higher than the full safety car rate, which means the combined probability of either event is significantly higher than the individual probability of each.
For betting purposes, the critical question is which market the bookmaker is pricing. A “safety car yes/no” bet that includes the VSC has a different implied probability than one that counts only full safety car deployments. Read the settlement rules carefully. Some sportsbooks settle on “any neutralisation” including VSC, while others require a full safety car. The distinction can flip a marginal bet from value to overpriced.
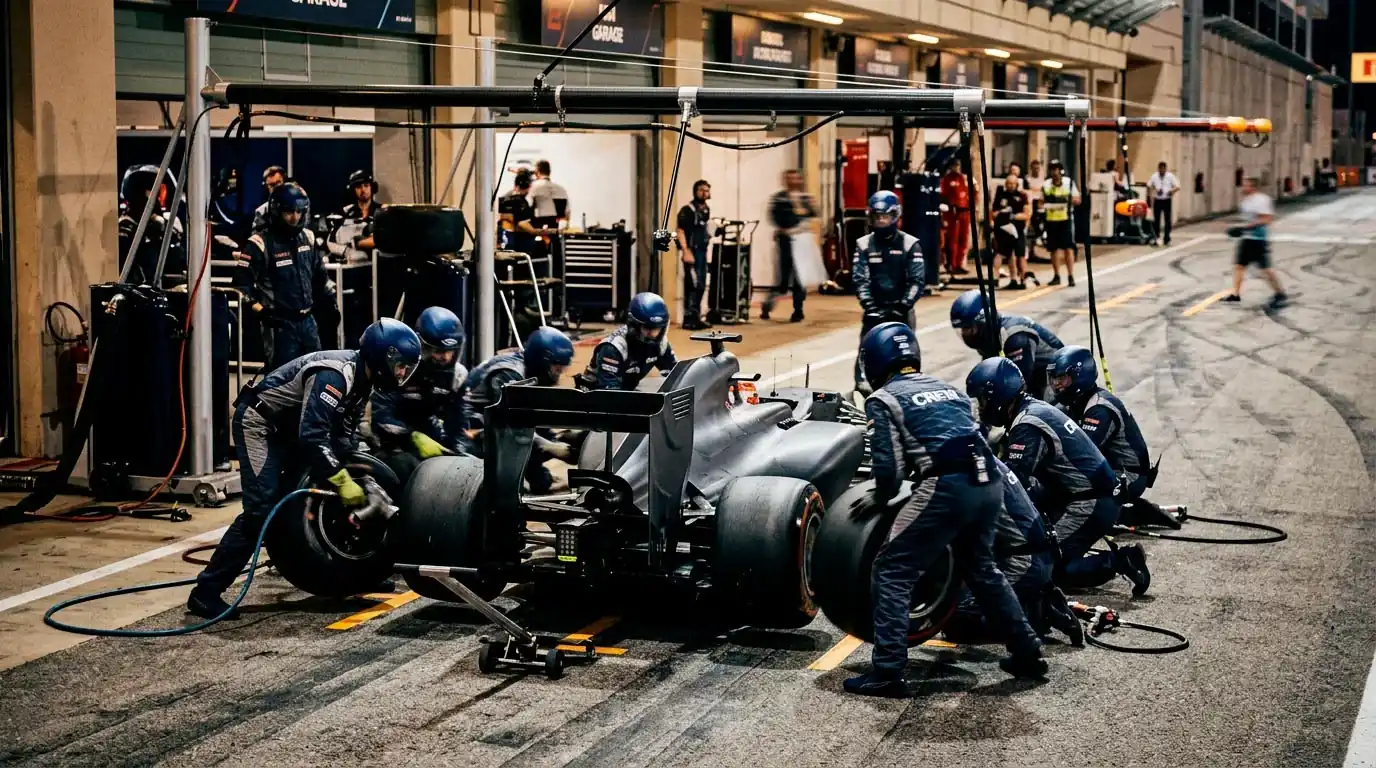
The VSC also interacts with other markets. A VSC during a pit window creates strategic chaos — teams that pit under the VSC gain a time advantage over those that do not, which can shuffle the race winner and podium markets dramatically. If you are tracking the safety car market as part of a broader race-day strategy, the VSC is not a lesser event. It is a market catalyst with its own distinct impact on every other bet you hold.
What factors determine F1 safety car betting odds at different circuits?
Circuit layout is the dominant factor. Street circuits with narrow tracks and concrete barriers produce safety cars at rates above 80 per cent over recent seasons, while permanent circuits with wide gravel runoff areas sit closer to 35-40 per cent. Other factors include weather forecasts, the number of first-lap incidents historically at the venue, and whether recent circuit modifications have added or removed runoff. Bookmakers set a season-average baseline and adjust partially for circuit type, but they rarely match the full historical rate, which is where value emerges.
Does the number of safety car laps affect other in-play markets?
Significantly. A full safety car bunches the field, erasing time gaps built over dozens of laps and creating restart scenarios where position changes are common. The longer the safety car period, the more the tyres cool and the more strategic recalculations teams must make about pit stops. In-play odds on the race winner, podium markets, and head-to-head matchups all reprice during a safety car period, and the restart itself is often the most volatile moment of the race for live odds movement.
Published by the Betting f1 team.